Slow the Spread
Funding Sources: USDA Forest Service
The National Slow the Spread (STS) Program represents one of the longest running and most geographically expansive integrated pest management programs in the world.
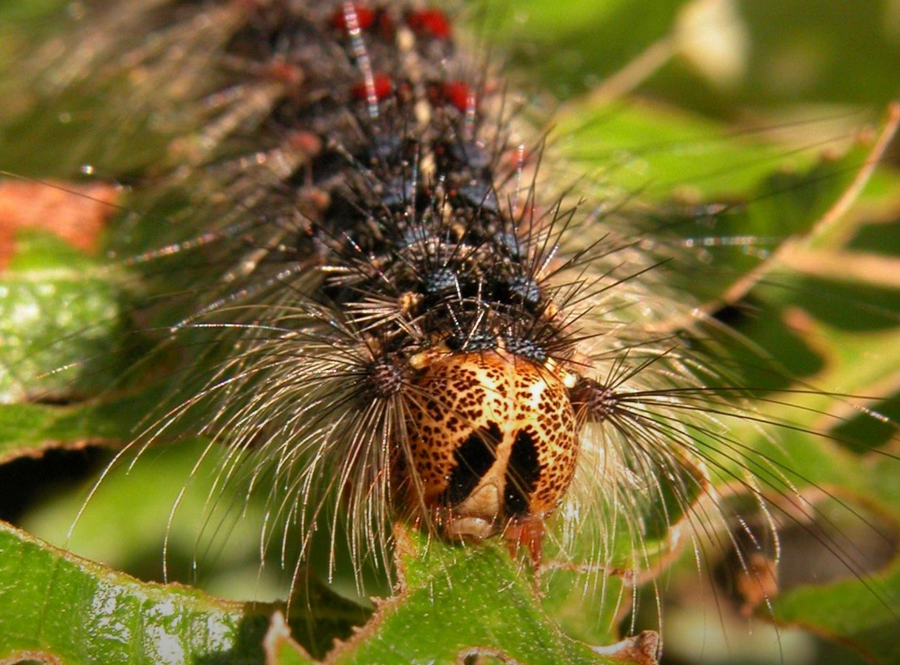
The program’s goal is to slow the rate of spread of spongy moth, Lymantria dispar L. (Lepidoptera: Erebidae, formerly known as the “gypsy moth”), by greater than 60 percent from its historical rate of spread (19.6 km/yr, an average of historical spread rates) in the United States (Liebhold et al. 1992). The Slow the Spread Foundation, a non-profit foundation, together with 12 states, two federal agencies, and two universities, have contributed to the success of the program since its inception in 2000.
Quick Links

Highlights


-
STS Story Map
The STS ArcGIS StoryMap ® is an interactive overview of the national management of Spongy Moth under the Slow the Spread Program. Included are an biological and ecological review; management history; and an overview of the STS program.
-
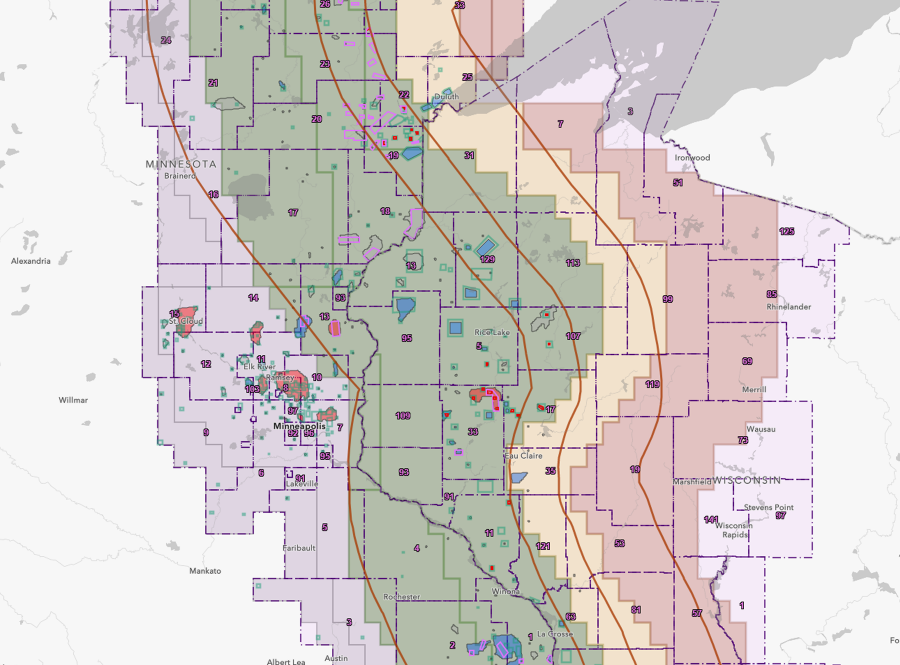
Interactive Project Map
The STS interactive map viewer application allows you to explore all of the key data layers of the project. These include current project boundaries; proposed mitigation actions; current year proposed, placed and inspected trapping sites.
-
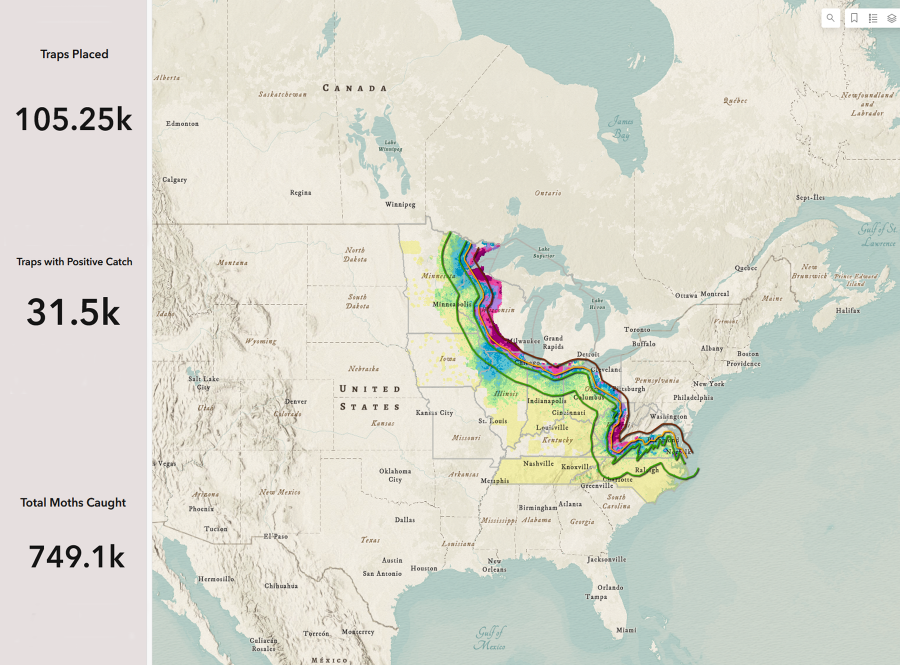
Trapping Dashboard
The trapping analytics dashboard provides both a current year overview of the number of traps placed, but additionally provides the ability to browse historically placed traps. You can search by year and state which will provide a summary of total traps placed; total positive traps; and total moths caught.
-
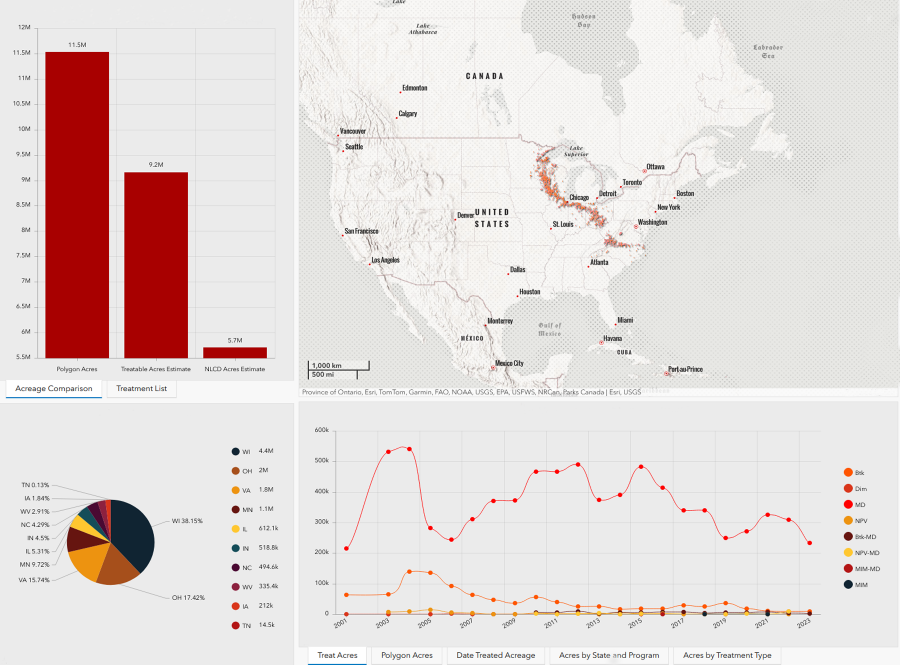
Treatment Dashboard
The treatment analytics dashboard provides you with a detailed overview of the treatment history. Users can filter treatment data by year, state and treatment type.


Stakeholders
